A new year has arrived! After completing the analysis of Golang Goroutine and GMP Model In-Depth Analysis, I gained a much more comprehensive understanding of the Go language. But after learning about GMP, aren’t we still missing the memory management aspect? So today, let’s dive deep into how Go manages its memory.
The Memory Management Debate
When it comes to memory management, there’s been a long-standing debate: who should manage memory — the machine or the developer? Whether it’s machine-managed or human-managed, everyone agrees that memory management is critically important, but opinions diverge:
- C/C++: “Memory management is so important that we should give engineers full control. We trust that they’re skilled enough to know when to allocate and when to free memory.”
- Java / .NET(C#) / Go / etc.: They take the opposite stance — while memory management is equally important, “we can’t trust humans. We prefer to manage memory automatically.”
Let’s consider the differences. C/C++ memory allocation and deallocation is indeed very efficient because engineers know exactly when memory is no longer needed and can free it immediately. However, humans make mistakes — if someone forgets to free memory, it leads to memory leaks and eventually program crashes.
In newer languages, the pursuit is developer productivity. They aim to manage memory automatically, reducing human error and increasing development efficiency. This makes memory management even more critical. So what challenges does memory management face?
Heap Memory Management Challenges
- Memory allocation requires system calls. Frequent memory allocation leads to lower system performance.
- When multiple threads share the same memory space and allocate memory simultaneously, locking is needed. Otherwise, the same memory block could be accessed by multiple threads.
- Memory fragmentation: After continuous allocation and deallocation, memory fragmentation becomes severe, reducing memory utilization.
These are the potential issues that traditional languages like C/C++ face when manually allocating heap memory without proper handling.
Heap Memory Management
So how do modern languages solve these problems?
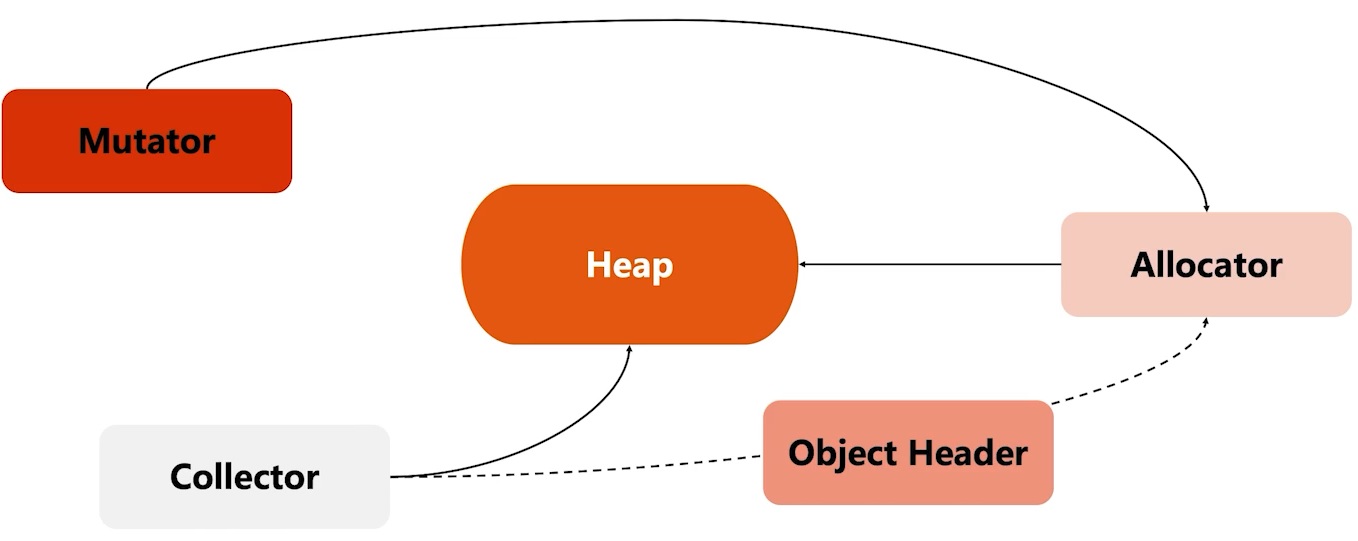
Assuming the heap is the currently available heap memory, there are three main roles and an auxiliary Header for managing this heap:
- Allocator: The memory allocator. Dynamically handles memory allocation requests. When the program starts, the Allocator pre-allocates memory from the OS during initialization and may format the memory.
- Mutator: The Mutator can be understood as our program. It only needs to request memory from the Allocator — it doesn’t need to explicitly free (reclaim) memory.
- Collector: The garbage collector. Reclaims memory space by scanning the entire heap memory to identify active vs. inactive objects. When inactive objects are found, it reclaims their memory.
- Object Header: When memory is allocated, it’s simultaneously tagged to mark the object. The Collector and Allocator synchronize object metadata through this.
Let’s look at how Go handles this:
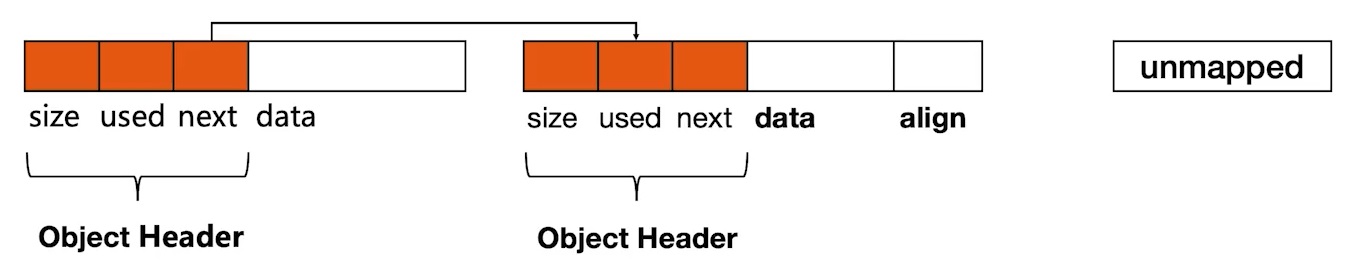
- Initialize contiguous memory as the heap.
- When memory is requested, the Allocator cuts small memory blocks from unallocated regions of the heap.
- Allocated memory blocks are connected using a linked list.
- Metadata is needed for each memory block: size, whether it’s in use, next memory block location, etc.
TCMalloc
Go’s memory management is designed based on TCMalloc, so before understanding Go’s memory management, let’s review TCMalloc (Thread Cache Malloc) principles.
Let’s recall the memory management challenges mentioned earlier in Heap Memory Management Challenges:
- Memory allocation requires system calls. Frequent memory allocation leads to lower system performance.
- TCMalloc pre-allocates and pre-partitions memory.
- When multiple threads share the same memory space and allocate simultaneously, locking is needed.
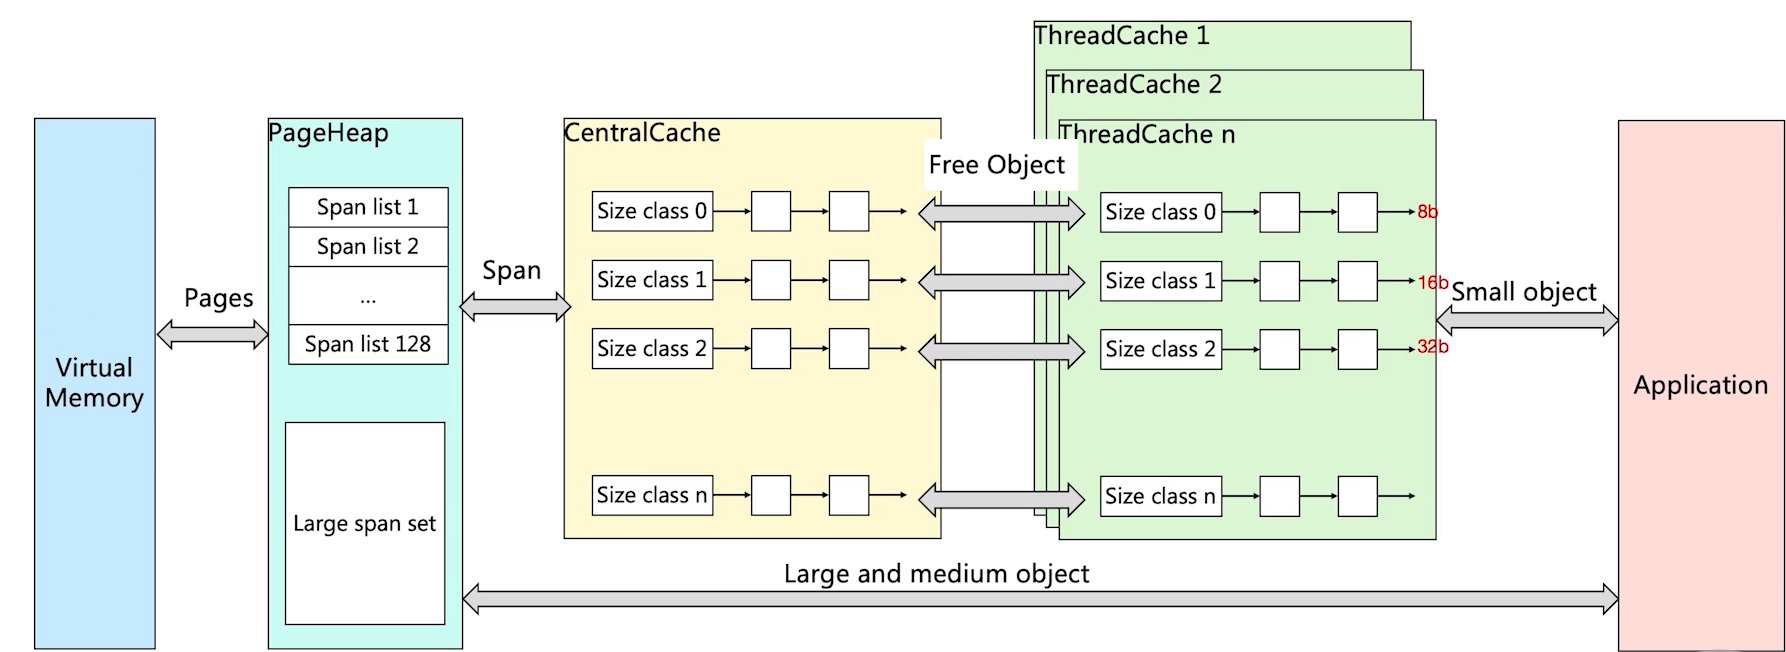
- Looking at the ThreadCache section: it maintains a ThreadCache for each thread, and each one is an independent memory space. When an application requests memory, it first requests from ThreadCache. Since each ThreadCache maintains its own memory, no locking is needed.
- What if ThreadCache runs out of memory? It requests from CentralCache, which does require locking. But as you’ve noticed, the likelihood of needing locks is already reduced.
- If CentralCache also runs out, it requests from PageHeap.
- If PageHeap also runs out, it requests more memory from VirtualMemory.
So TCMalloc solves the memory management challenges and provides a tiered memory allocation mechanism. But consider this: if applications always request memory from ThreadCache regardless of object size, wouldn’t memory management become chaotic?
TCMalloc enhances this by dividing memory into different levels (Size Classes). It still allocates memory page by page (8KB per page), but it divides allocated memory according to different Size Classes (each corresponding to a size, e.g., 8 bytes, 16 bytes). There are 128 classes in total, and same-sized Size Classes form Span lists. When an application requests one byte, TCMalloc allocates from Size Class 0. For large objects, it bypasses ThreadCache and CentralCache to request directly from PageHeap. This is the implementation principle of TCMalloc.
- Page: A memory page, an 8KB block. Memory allocation and deallocation between Go and the OS is done in page units.
- Span: A memory block consisting of one or more contiguous pages.
- SizeClass: A space specification. Each span has a SizeClass indicating how pages in the span should be used.
- Object: Used to store variable data in a memory space. When a span is initialized, it’s divided into equally-sized objects. If an object is 16B and the span is 8K, the span’s pages are initialized as 8K / 16B = 512 objects. When an application requests memory, one object is allocated.
- Object size definitions:
- Small objects: 0 ~ 256KB
- Medium objects: 256KB ~ 1MB
- Large objects: > 1MB
- Small object allocation flow: ThreadCache -> CentralCache -> HeapPage. Most of the time, ThreadCache has sufficient cache, eliminating the need to access CentralCache and HeapPage. No locking needed, so allocation is very efficient.
- Medium object allocation flow: Select an appropriate size directly from PageHeap. Spans of 128 pages hold the maximum 1MB.
- Large object allocation flow: Select an appropriate number of pages from the large span set to form a span for data storage.
Go Memory Allocation
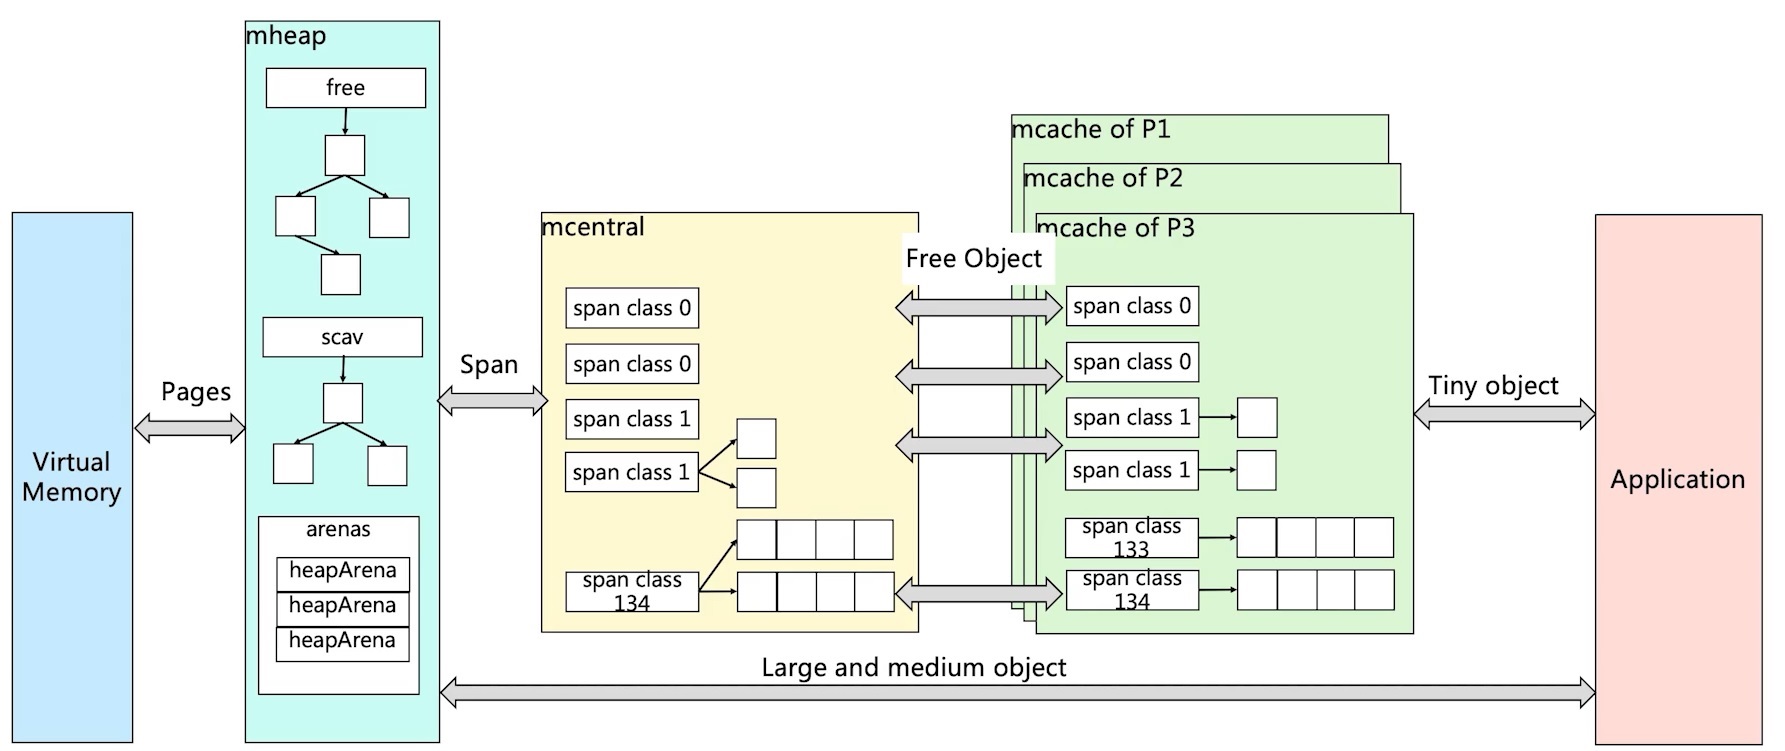
Go’s memory allocation is essentially the same as TCMalloc — it’s a modified and enhanced version of TCMalloc. The diagram below looks similar to TCMalloc but has some differences:
- In mcache, one span class corresponds to two span classes: one stores pointers and one stores direct references. Spans storing direct references don’t need GC.
- When mcache doesn’t have enough memory, it requests from mcentral, first checking the nonempty list (which has available pages). If still not found, it requests from mheap.
- Note: mcache obtains and returns spans from/to mcentral.
- Obtaining: Lock, find an available span from the nonempty list, remove it from nonempty, add it to empty, return the span to the worker thread, unlock.
- Returning: Lock, remove the span from the empty list, add it to the nonempty list, unlock.
- Note: mcache obtains and returns spans from/to mcentral.
- In mheap, a Binary Sort Tree is maintained by Span Class, with two trees:
- free: Contains free spans that are not from garbage collection.
- scav: Contains free spans that have been garbage collected.
- If a span is freed by garbage collection, it goes to scav; otherwise it goes to free (e.g., memory freshly requested from Virtual Memory).
- mcache: Small object memory allocation.
- There are 67 size classes. Class 0 is a special span for objects larger than 32KB. Each class has two spans.
- Span size is based on 8KB, divided by span class size.
- mcentral:
- When all memory blocks in mcache’s span are occupied, mcache requests a span from mcentral. After obtaining it, mcache continues allocating objects.
- When mcentral provides a span to mcache and there’s no matching span, mcentral requests from mheap.
- mheap:
- When mheap doesn’t have enough memory, it requests from the OS.
- mheap maintains spans using a Binary Sort Tree instead of a linked list.
- Heap performs span maintenance, including address mapping and metadata about whether spans contain pointers, for more efficient allocation, reclamation, and reuse.
Memory Reclamation
Common Memory Reclamation Strategies
Reference Counting
- Common languages: Python, PHP, Swift
- Characteristics: Maintains a reference count for each object. When an object referencing it is destroyed, the count decreases by 1. When the count reaches 0, the object is reclaimed.
- Pros: Objects can be reclaimed quickly — no need to wait until memory is exhausted or a threshold is reached.
- Cons: Doesn’t handle circular references well, and maintaining reference counts has its own overhead.
Mark and Sweep
- Common languages: Go
- Characteristics: Starting from root variables, traverses and checks all referenced objects. Referenced objects are marked as “referenced.” Unmarked objects are reclaimed.
- Pros: Solves the shortcomings of reference counting.
- Cons: Requires STW (Stop the World) — the program must be paused.
Generational Collection
- Common languages: Java, .NET(C#), Node.js (JavaScript)
- Divides memory into different generation spaces based on object lifetime. Long-lived objects go to the old generation; short-lived ones go to the young generation. The young generation is collected more frequently than the old generation. Typically divided into three generations:
- Young: Also called “eden.” Stores newly created objects with very short lifetimes — they can almost be reclaimed immediately after use.
- Tenured: Also called “old.” Objects that survive multiple collections in the Young area are moved here.
- Perm: The permanent generation. Mainly stores loaded class information with long lifetimes — rarely collected.
- Pros: Most objects are short-lived, so this efficiently clears disposable objects.
- Cons: The algorithm is more complex with more execution steps.
Go GC Workflow
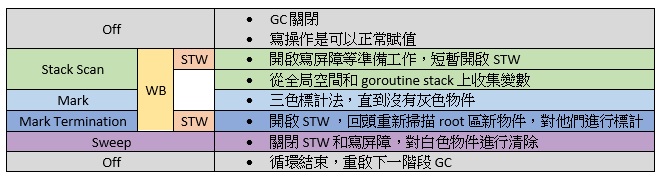
Most of Go’s GC processing runs concurrently with user code. It’s roughly divided into four steps, basically Mark and Sweep.
- Mark
- Mark Prepare: Initialize GC tasks, including enabling the write barrier (WB) and mutator assist, and counting root object tasks. This requires STW (Stop the World).
- GC Drains: Scan all root objects, including global pointers and goroutine (G) stack pointers (the corresponding G must be stopped during scanning). Add them to the mark queue (gray queue) and process gray queue objects in a loop until it’s empty. This process runs concurrently in the background.
- Mark Termination: Complete marking work, rescan global pointers and stacks. Since marking runs concurrently with user code, new objects and pointer assignments may occur during marking. The write barrier records these, and rescan checks them. This process also requires STW.
- Sweep: Reclaim all white objects according to marking results. This process runs concurrently in the background.
- Sweep Termination: Clean up unswept spans. A new GC round can only begin after the previous round’s sweeping is complete.
Tri-Color Marking
- When GC starts, all objects default to garbage (white).
- Starting from the root area, found objects are marked gray.
- For all gray objects, their internally referenced variables are marked gray, and the objects themselves are marked black.
- Repeat the above steps until no gray objects remain — only black and white. White objects are garbage.
- For black objects, if a write operation occurs during marking, the write barrier marks the object gray before the actual assignment.
- During marking, objects newly allocated by mallocgc are marked black before being returned.
Go Garbage Collection Trigger Mechanisms
- Memory allocation threshold triggers GC:
- Each memory allocation checks whether the current allocation has reached the threshold. If so, GC starts immediately.
- Threshold = previous GC memory allocation * memory growth rate.
- Memory growth rate is controlled by the GOGC environment variable, defaulting to 100 (GC starts when memory doubles).
- Each memory allocation checks whether the current allocation has reached the threshold. If so, GC starts immediately.
- Periodic GC trigger:
- By default, GC is triggered every two minutes. This interval is declared in the src/runtime/proc.go:forcegcperiod variable.
- Manual trigger:
- In code, you can use runtime.GC() to manually trigger GC. This is mainly used for GC performance testing and statistics.
Conclusion
After reading such hardcore knowledge from the previous article, today we tackled the history of memory management all the way to Go’s memory management. It felt a bit painful after reading, but this will become a great source of nourishment for our growth, right? What are your thoughts after reading?
Feel free to leave a comment on my blog. Your feedback motivates me to keep writing. Thank you for reading, and let’s grow together to become better versions of ourselves.